7 Ups and downs of Population
Prologue | Details | Outline | Vocabulary | Data Sheet, 12 | Density | Profiles | Dynamics | Two Formulas | Impact | Doubling time
“Human population growth has been so prodigious
in recent centuries that it has also become a major driver of environmental
deterioration, in the extent of pollution, consumption of natural resources,
and destruction of habitats needed by other species.”
p. 140
Prologue | Details | Outline | Vocabulary | Data Sheet, 12 | Density | Profiles | Dynamics | Two Formulas | Impact | Doubling time
Overview
“the elephant in the living room” is the matter of population
size
Population genetics and gene pools:
“Population genetics
is concerned with changes through time in the composition of gene pools (all the genetic information possessed
by a population), …; population dynamics or demographics … is about changes to the
numbers of individuals and in the forces that produce these changes in a given
population.” (140)
Population is “an input-output system.” – see formulas { 141
. Butterfly dynamics–checkerspot butterfly life cycles { 141
.
Human dynamics – 6.859 billion people July ‘10 { 142
. Family Planning { 144
. Curbing the population explosion { 146
. The arithmetic of population growth { 149
.
Population pyramids { 151-52
.
Population momentum { 153
. Aging populations { 155
Prologue | Details | Outline | Vocabulary | Data Sheet, 12 | Density | Profiles | Dynamics | Two Formulas | Impact | Doubling time
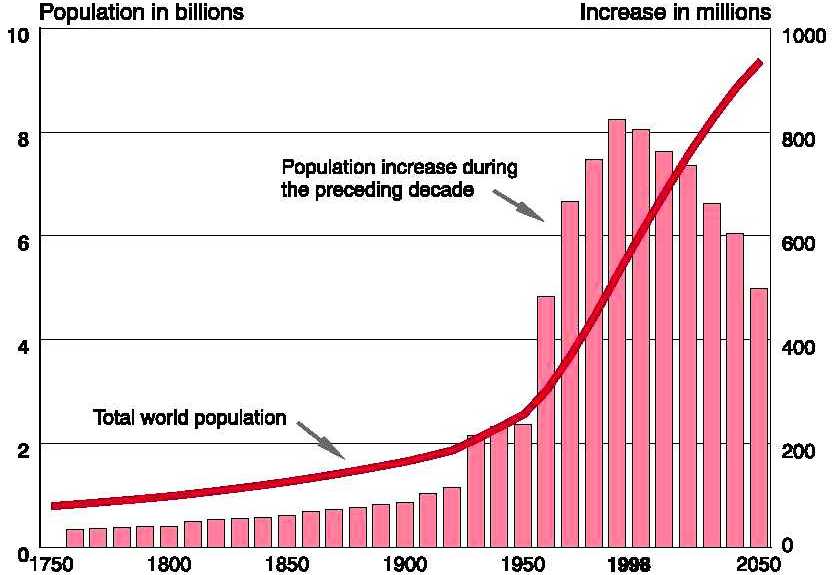
| Year | number of inhabitants | people per square mile |
|---|---|---|
| 1810 | 1,000,000,000 | 17.4 |
| 1850 | 1,171,000,000 | 20.4 |
| 1900 | 1,608,000,000 | 27.9 |
| 1930 | 2,000,000,000 | 34.8 |
| 1960 | 2,972,000,000 | 51.7 |
| 2000 | 6,080,000,000 | 105.7 |
| 2012 | 7,000,000,000 | 121.7 |
57,500,000 square miles of dry land.
Source: maps of growth-- http://desip.igc.org/populationmaps.html
http://www.vaughns-1-pagers.com/history/world-population-growth.htm
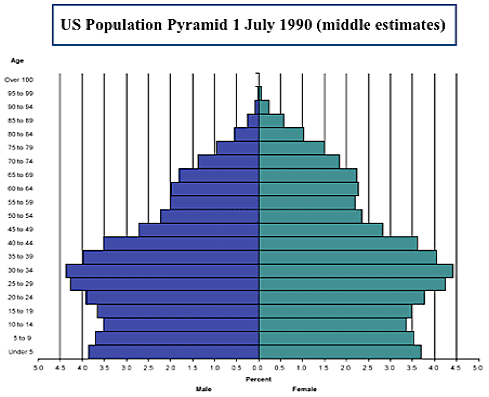
Population profiles or pyramids of an aging United States.
Three patterns inherent in population profiles:
youthful & growing | stabilizing slowly | aging & declining
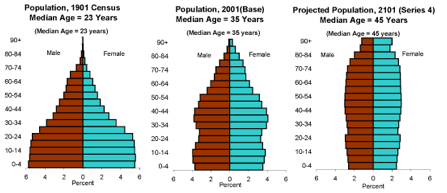
The width of the lines is proportional to the number of people in that age group, called cohorts; males on the left, women on the right.
Prologue | Details | Outline | Vocabulary | Data Sheet, 12 | Density | Profiles | Dynamics | Two Formulas | Impact | Doubling time
Formulas
Population is P
N
– M + (Em ± Im) = P
The natality is N for fertility or birth rates. M is mortality or death rates.
(N) Fertility minus (M) mortally (plus or minus migration) equals population
migration
• immigration is Im the measure of people coming to a designated area; into = "+"
• emigration is the inverse or Em and refers to the number of people leaving a designated area; out of = "–"
Prologue | Details | Outline | Vocabulary | Data Sheet, 12 | Density | Profiles | Dynamics | Two Formulas | Impact | Doubling time
Impact is represented by the letter I.
Impact formula.
I = P * A * T
Impact
is equal to Population times Affluence times Technical capabilities that affect carrying capacity.
| 2012 estimates | Africa | Asia | Europe | North America | |
|---|---|---|---|---|---|
| I | impact | 2.8 | 29.2 | 20.1 | 16.1 |
| = | |||||
| P | population | 1072 | 4260 | 740 | 349 |
| * | in millions | ||||
| A | affluence or per capita income | $2,630 | $6,860 | $27,080 | $46,400 |
| * | GNP (US, 2010 equivalent) | ||||
| T | technology or carbon footprint / electricity use | 4,532 | 2,631 | 5,692 | 12,914 |
| S. Africa | China | UK | USA | ||
| People per square kilometer | |||||
| D | density | 35 | 134 | 32 | 16 |
Note: electricity use or, Electric power consumption (kWh per capita)
Electric power consumption measures the production of power plants and combined heat and power plants less transmission, distribution, and transformation losses and own use by heat and power plants.
Source: World Bank.
Source: World Population Data Sheet.
There is a problem, for example, with African & Asian electricity figures:
African figures:
| Nations | Congo | Kenya | Egypt | Botswana |
|---|---|---|---|---|
| KW hours / capita | 151 | 149 | 1440 | 1533 |
Asian figures:
| Nations | China | India | Indonesia | Japan |
|---|---|---|---|---|
| KW hours / capita | 2631 | 171 | 590 | 7819 |
Because the averages for Asia and Africa mask these extreme regional differences.
Prologue | Details | Outline | Vocabulary | Data Sheet, 12 | Density | Profiles | Dynamics | Two Formulas | Impact | Doubling time
Case studies in dynamics
France
French population change 1901-2001
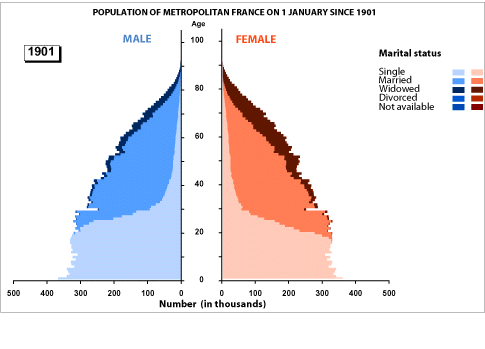
The width of the lines reflects the number of people in that age group or cohort.
Prologue | Details | Outline | Vocabulary | Data Sheet, 12 | Density | Profiles | Dynamics | Two Formulas | Impact | Doubling time
The algorithm for how long it takes for a known rate of increase (a percent per year) to double is called:
"The rule of 70"
% / 70 = TD
percent ÷ 70 equals doubling time [TD]
Summary
“ . . . the problems
that continued rapid global population growth is now bringing to the planet,
that, in the view of the vast majority of knowledgeable scientists is already
overpopulated.”
p. 157
US Bureau of the Census on line
![]()
Population
dynamics is the key to understanding the human reality
of birth, death and migration as it characterizes any region.
Understanding aggregate behavior of large numbers allows us to put cases of individuals and regional impacts into a more understandable perspective.
For example, the aging of the populations in Japan and Russia will affect each nation's ability to consume resources despite the differences in the compact area of the island of Japan and the huge area of Siberia that Russians and other nationalities may use.
Twenty years of population growth may indicate the need to compare more data for nations with respect to density, urbanization per capita income and commercial range.
Compared to the United States (USA) with 265.2 million people and .75 hectares of cropland per person available in the 1990s, consider these five nations:
1990
World population was 5,771 million people.
| Nations | Japan | Russia | France | Thailand | India | measure |
|---|---|---|---|---|---|---|
| population | 125.8 | 147.7 | 58.4 | 60.7 | 949.6 | millions |
| per capita cropland | .04 | .79 | .34 | .41 | .20 | hectares |
2010
World population was 6,892 million people.
| Nations | Japan | Russia | France | Thailand | India | Egypt | USA | measure |
|---|---|---|---|---|---|---|---|---|
| population | 127.4 | 141.9 | 63 | 68.1 | 1188.8 | 80.4 | 309.6 | millions |
| density | 337 | 8 | 114 | 133 | 362 | 80 | 32 | / sq. kilometers |
Over time the US population is shifting due to fertility rates and migration, the largest proportion of increase from fertility is now among Latino or Hispanic populations, with those under 18 years of age having increased 38 per cent in a decade (2000-2010) compared to a 9.8 per cent decline in the white population and a 2.3 percent decline in the African-American population of the same age group (under 18).
Prologue | Details | Outline | Vocabulary | Data Sheet, 12 | Density | Profiles | Dynamics | Two Formulas | Impact | Doubling time
Terms
A hectare is 10,000 square meters or
2.471 acres.
Exponential growth [migration] versus natural increase [fertility]
Growth:
"Population growth has been so prodigious in recent centuries that it has also become a major driver of environmental deterioration, in the extent of pollution, consumption of nature's resources, and destruction of habitats needed by other species."
p. 140.
Exponential growth patterns are due to migration, not natural increase or refined fertility rates.
![]()
Prologue | Details | Outline | Vocabulary | Data Sheet, 12 | Density | Profiles | Dynamics | Two Formulas | Impact | Doubling time
Natural increase is linked with the Golden ratio through the Fibonacci sequence, (C. below)
which is given by
| alpha | Type of increase | 1st |
2d |
3d |
4th |
5th |
6th |
7th |
8rth |
9th |
10th |
11th |
12th |
|---|---|---|---|---|---|---|---|---|---|---|---|---|---|
| D | deficit (minus) |
0 |
1 |
2 |
5 |
11 |
24 |
51 |
107 |
222 |
457 |
935 |
1904 |
| C | fibonacci | 1 |
1 |
2 |
3 |
5 |
8 |
13 |
21 |
34 |
55 |
89 |
144 |
| B | exponential > | 1 |
2 |
4 |
8 |
16 |
32 |
64 |
128 |
256 |
512 |
1024 |
2048 |
| A | arithmetic sequence | 1 | 2 | 3 | 4 | 5 | 6 | 7 | 8 | 9 | 10 | 11 | 12 |
Vocabulary
Demography: fertility, mortality, immigration, emigration, natural increase
Natality,
Infant death, contraception,
migration,
Malthusian dilemma.
exponential versus
arithmetic growth, inverse square law, correlation.
Prologue | Details | Outline | Vocabulary | Data Sheet, 12 | Density | Profiles | Dynamics | Two Formulas | Impact | Doubling time
![]()
Overview
“the elephant in the living room” is the matter of population
size
“Population genetics
is concerned with changes through time in the composition of gene pools (all the genetic information possessed by a population), …; population dynamics or demographics … is about changes to the
numbers of individuals and in the forces that produce these changes in a given
population.” (140)
Population is “an input-output system.” – see formulas { 141
.
Butterfly dynamics–checkerspot butterfly life cycles { 141
.
Human dynamics – 6.859 billion people July ‘10 { 142
.
Family Planning { 144
.
Curbing the population explosion { 146
.
The arithmetic of population growth { 149
.
Population pyramids { 151-52
.
Population momentum { 153
. Aging populations { 155
Prologue | Details | Outline | Vocabulary | Data Sheet, 12 | Density | Profiles | Dynamics | Two Formulas | Impact | Doubling time
![]()